

Key Takeaways
- The U.S. landscaping services industry reached $188.8 billion in 2025 with 5.8% annual growth, meaning benchmark-driven marketing is now the difference between capturing demand and leaving it on the table (IBISWorld).
- Home services search ads averaged a $7.85 cost-per-click in 2025, and landscaping specifically posted one of the lowest category CTRs at 4.69%, so creative and targeting pull outsized weight on ROI (LocaliQ).
- Average landscaping cost-per-lead sits near $75, while home-services landing pages only convert at 3-5%, versus 6.6% across all industries (Unbounce).
- Organic search delivers 53.3% of all website traffic, and SEO leads close at 14.6% compared with 1.7% for outbound, which makes local search a compounding asset for landscaping companies (Digital Silk SEO Stats).
- A healthy LTV:CAC ratio is 3:1, and responding to a new lead within 60 seconds can lift conversions by 391%, making speed and lifetime value two of the highest-leverage landscaping marketing KPIs (Lead response research).
Roughly 692,777 U.S. landscaping companies are competing for attention in a $188.8 billion market, and the winners share one habit: they measure what they spend against real landscaping marketing benchmarks. This guide translates the numbers your ad platforms, CRM, and website produce into decisions you can act on this week, so every dollar works harder.
Why Do Landscaping Marketing Benchmarks Matter Right Now?
Benchmarks matter because the landscaping industry just added billions in revenue while ad costs climbed. IBISWorld pegs 2025 U.S. landscaping services revenue at $188.8 billion, and 75% of home services businesses saw CPC rise in LocaliQ’s 2025 data. Without benchmarks, you cannot tell a bad month from a tough market.
The National Association of Landscape Professionals’ 2025 Financial Benchmark Study found that participating companies carried a median 355 customers and generated $14,682 per customer, with typical sales growth of 8.5%. If your marketing is not compounding toward those numbers, the gap is fixable, but only when you can see it.
Benchmarks turn marketing from a gut-feel cost center into a measurable growth engine. They tell you whether a slow spring is a seasonal dip or a positioning problem, whether your ads are underperforming or your quoting workflow is leaking revenue, and whether your website is pulling its weight inside our landscape marketing mix.
What Should You Expect to Pay Per Lead and Per Click?
Home services advertisers averaged a $7.85 CPC and 6.37% CTR on Google search ads in 2025, per LocaliQ’s analysis of 3,211 home-services campaigns. Landscaping posted the category’s lowest CTR at 4.69%, and the cross-industry average cost-per-lead hit $70.11. Use those as your opening baselines before layering in local nuance.
Industry sources peg landscaping cost-per-lead (CPL) closer to $75 on average, while HVAC, electrical, and other trades can run $100 to $250 CPL with 30 to 90 day sales cycles. A CPL well above $100 is a signal, not a sentence. Look at ad relevance, geo radius, negative keywords, and landing page match rate before you move budget.
Pair CPC and CPL with revenue per lead. If your average job is $4,500 and you close 20% of leads, a $150 CPL still produces a 6:1 return. That is where honest pay-per-click marketing measurement beats vanity dashboards every time.
Watch for seasonality too. LocaliQ data shows home-services CPC rose for 75% of advertisers year over year, with some categories climbing 46% or more. For landscaping, CPC typically spikes in March through May as demand peaks, so your Q1 CPL benchmark should be 20-30% higher than your Q3 number. Building a seasonal CPL curve prevents you from pausing campaigns at exactly the wrong moment.
How Do Conversion Rates Stack Up for Landscaping Companies?
Unbounce’s analysis of 41,000 landing pages puts the average conversion rate near 6.6%, while home improvement sits between 3-5%. Landscaping organic conversion rates have historically averaged around 8.44%. High-intent inbound leads can close at 15-30%, which is why lead quality beats lead volume.
Response speed is the hidden multiplier. Research compiled by Vendasta shows a 391% conversion lift when leads are contacted within 60 seconds, and 78% of customers buy from the first company that replies. If your team answers in hours instead of minutes, your benchmark gap is in operations, not marketing.
Measure three conversion stages: visit-to-lead, lead-to-quote, and quote-to-contract. A high visit-to-lead rate with a low quote-to-contract rate points at pricing, proposal clarity, or follow-up. The fastest wins usually live at the website stage, where landscape companies still lose the majority of their traffic.
One quick audit: load your website on a mobile device, time how long it takes to find your phone number, and see whether your quote form asks for more than five fields. Industry data shows 61% of searches happen on mobile, and every extra form field drops conversion by roughly 4-7%. Fixing those two friction points often outperforms a 20% increase in ad spend.
What Does a Healthy ROAS Look Like for Landscaping Ads?
Across Google Ads, the average ROAS is roughly 2:1, with healthy campaigns landing between 2:1 and 4:1. Home services benchmark data from SearchLight Digital shows a median HVAC ROAS of 4.37x and top-quartile performers over 10x. Landscaping margins are similar, so most companies need 4x ROAS just to stay profitable.
Calculate ROAS per channel, not per account. Local Services Ads, paid search, display retargeting, and paid social all behave differently. A blended 4x can hide a 9x paid-search campaign subsidizing a 1.5x display test. Isolating channels lets you shift budget into the compounding winners.
Build ROAS reports directly inside your CRM or spreadsheet, not just inside Google Ads, so revenue ties back to actual signed jobs. If that plumbing does not exist yet, our tracking and analytics services wire conversions, revenue, and phone calls into a single picture.
Keep two ROAS numbers side by side: reported ROAS (what the ad platform claims) and realized ROAS (what actually landed in your bank account). The two drift apart because of cancellations, unsold quotes, and attribution lag. First Page Sage’s ROAS research shows that realized ROAS typically lands 20-30% below reported. Planning against realized numbers keeps your budgeting honest.
How Much Traffic Should Come From Local SEO and Google Business Profile?
Organic search drives 53.3% of all website traffic, and SEO leads close at 14.6% versus 1.7% for outbound. For a local landscaping business, Google Business Profile (GBP) is the amplifier: BrightLocal reports 49% of businesses receive more than 1,000 GBP views per month, and customers are 2.7x more likely to view a complete profile as reputable.
“Near me” search volume continues to climb, with 800 million monthly U.S. searches including a “near me” variation and 76% of those searchers visiting a business within a day. For a lawn or landscape company, ranking in the 3-pack for “landscaper near me” or “lawn care [city]” often outperforms a month of paid spend.
Target three things: rank in the local 3-pack for your core service-plus-city queries, earn GBP messages and calls each week, and keep your NAP (name, address, phone) consistent across directories. Our SEO services and lawn care marketing services are built around these three local levers.
BrightLocal research shows position one in the local 3-pack captures roughly 23.6% of clicks, significantly more than positions two or three. Combine that with a 4.7+ star rating and you compound CTR on every query. The benchmark to chase: top-3 ranking for at least five core service-plus-city keywords within 12 months of investing in local SEO.
How Do Reviews and Reputation Impact Your Benchmarks?
BrightLocal’s 2025 Local Consumer Review Survey shows 88% of consumers would use a business that replies to all reviews, compared with only 47% for businesses that never reply. 52% of consumers will not consider a business under 4 stars, and each additional Yelp star can lift revenue up to 9%. Reviews are now a top-three local ranking factor and a CTR multiplier.
Set a review velocity benchmark, not just a star-rating target. If you book 40 new customers per month, aim for at least 20% of them leaving a Google review, which over a year compounds into hundreds of ranking signals. Use post-job SMS prompts, QR codes on invoices, and a tasteful email follow-up sequence to hit it.
Then act on the review data. BrightLocal found going from 3 stars to 5 stars earns 25% more clicks in local results. A single operational fix like crew punctuality or estimate turnaround can move your star rating a half point, which compounds into higher CTR on every future search.
Which Email and Social Benchmarks Should Landscapers Track?
Across industries, the 2025 average email open rate climbed to 43.46% with a 2.09% click rate. For landscaping companies, seasonal nurture emails often outperform those averages because homeowners schedule work months ahead. A 45% open rate and 3% CTR are realistic targets for spring kickoff campaigns.
On social, chase engagement over follower counts. A like-to-follower ratio above 2% on Instagram and saved posts on seasonal guides tend to predict inbound quotes better than reach. Video walkthroughs of completed projects are the highest-performing format across home services feeds.
Most important, tag every lead source. If you cannot tell whether last month’s 14 new clients came from email, organic, paid, or referrals, you are missing the channel mix benchmark. Attribution does not need to be perfect, but it needs to be consistent.
Build a simple channel-mix benchmark: aim for no single source to produce more than 50% of your leads long-term. Landscaping companies that lean 80%+ on paid ads see margin crumble when CPC spikes in peak season, while those that rely only on referrals struggle to scale. A mix of roughly 35% organic and local SEO, 25% paid, 25% referrals, and 15% email and social tends to age well.
How Should You Benchmark Customer Acquisition Cost and Lifetime Value?
A healthy LTV:CAC ratio is 3:1, with anything below 1:1 considered unsustainable. Most firms allocate no more than 25-33% of LTV to acquisition. For landscaping, that math hinges on retention: a full-service maintenance client who stays three seasons can be worth 5-10x a one-time install.
Calculate CAC by combining every marketing and sales dollar for a period and dividing by new customers acquired. A $6,000 monthly spend that produces 20 customers yields a $300 CAC. Then measure LTV as gross profit per customer times average retention in years. For more on connecting marketing spend to profit, see our guide on measuring marketing ROI.
Benchmark CAC against channel, season, and service line. A commercial snow contract and a residential lawn-mow subscription have very different acquisition economics. When CAC drifts, the fix is usually inside your funnel, not your ad budget. Our deeper breakdown of landscaping business financials shows where the leaks usually sit.
Track payback period alongside LTV:CAC. Payback period is how many months of gross profit it takes to recover your acquisition cost. For residential maintenance, aim to recover CAC within the first season. For bigger design-build projects, a single job often covers 5-10x the acquisition cost in revenue, so the real benchmark is follow-on work and referrals over the next three years.
Retention is the quiet LTV multiplier. Even a small lift in your renewal rate, say from 70% to 80% year over year, can nearly double three-year LTV. That changes how much you can profitably spend on acquisition and often opens up paid channels that previously looked too expensive.
How Do You Build Your Own Landscaping Marketing KPI Dashboard?
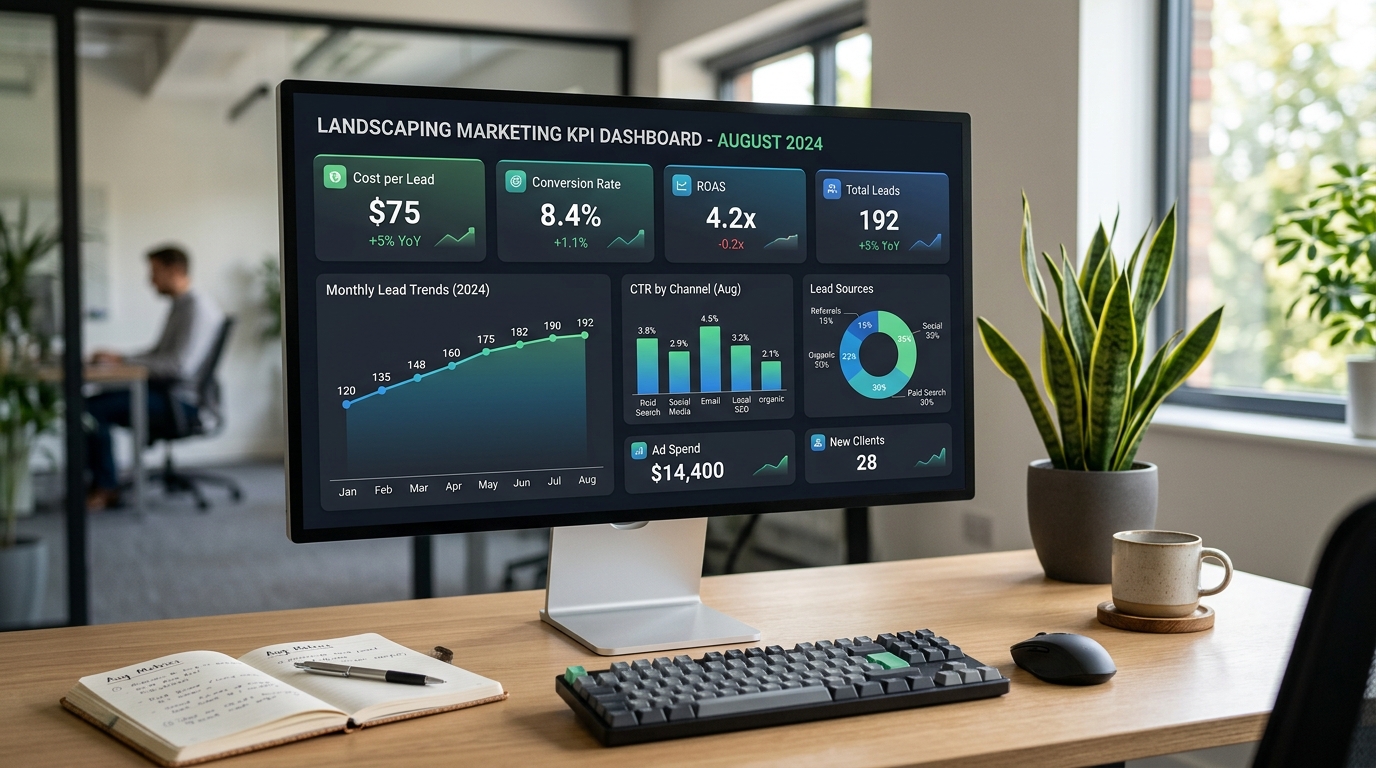
A working KPI dashboard tracks a dozen numbers, not a hundred. Databox found that marketers who review benchmarks monthly are significantly more likely to beat their goals. Pull numbers weekly for operational KPIs (lead volume, response time) and monthly for strategic KPIs (ROAS, CAC, LTV).
Start with six core metrics: website sessions, lead volume by source, CPL by channel, quote close rate, average job value, and ROAS. Then add one local-SEO metric (GBP actions or 3-pack rankings) and one reputation metric (Google review count and average rating). That is enough to catch 80% of the signal without drowning your team.
For a step-by-step breakdown of which numbers to build first, our guide on essential landscaping business metrics pairs well with this post, and our deeper look at paid advertising channels shows how to benchmark each channel once your dashboard is live.
Make the dashboard visible. Print it, pin it in the office, or screen-share it every Monday morning. Teams that see the numbers weekly make smaller, faster course corrections. Teams that only see reports quarterly end up with expensive surprises. A shared dashboard also gives sales, field crews, and marketing one version of the truth, which removes a lot of internal friction.
Set thresholds, not just targets. For every KPI, define a green zone, a yellow warning, and a red action trigger. If CPL crosses its red line for two consecutive weeks, someone is accountable for a specific review within 72 hours. That turns your benchmarks from passive numbers into an active operating system.
What Pitfalls Should You Avoid When Benchmarking?
Industry averages lie when you treat them as targets instead of baselines. The $7.85 home services CPC LocaliQ reports is a national blend, and a Phoenix irrigation company competes against different bidders than a Boston snow-and-landscape hybrid. Always adjust benchmarks for market, service mix, and season before setting goals.
Watch for vanity metrics. Impressions, follower counts, and raw website visits feel satisfying, but they rarely predict revenue. If a metric does not link to a lead, a quote, or a signed job, it belongs in a secondary report, not your main dashboard. Our breakdown of why high ROI does not always equal profit unpacks this trap in detail.
Finally, avoid the set-and-forget mistake. Benchmarks expire. Seasonal demand, platform changes, and local competition shift quarterly. Review your landscaping marketing benchmarks every quarter at minimum, and after any major campaign, service-line, or pricing change. Our marketing-by-the-numbers roadmap shows a quarterly rhythm that works.
A last guardrail: never benchmark a channel on a single month of data. One strong month can be a lucky weather break, one weak month can be a Google update, and small samples produce false confidence. Give every campaign at least 60-90 days of spend and 30 or more conversions before you decide to scale or cut. Patience protects your benchmark integrity.
FAQ
Turn Your Benchmarks Into Predictable Growth
You now have a grounded starting line: a ~$75 landscaping CPL, a 4x ROAS floor, an 8-10% conversion target, a 3:1 LTV:CAC ratio, and a local search engine that drives more than half of your potential traffic. The next move is fitting those landscaping marketing KPIs to your market, service mix, and growth goals, then reviewing them on a monthly rhythm your team will actually keep.
Sideways8 builds benchmark-driven marketing programs for landscape and lawn care companies across North America. If you want a second pair of eyes on your numbers and a plan that ties landscaping advertising, SEO, and conversion to real revenue, contact our team or explore who we serve to see what a benchmark-driven growth partnership looks like.
